A quality meteorological station needs to be accurate, have a large storage capacity and its data need to be easily accessible. Meteo stations that exist do not have all these three qualities and are rather expensive for the hardware used. Furthermore each one has a closed ecosystem, so the data collected cannot be shared with other applications.
The Raspberry Pi is a low cost, low energy computer, with the addition of a 40-pin GPIO header. Its memory card slot and USB port means that there is an immense storage space and its ethernet port allows it to be accessible from the Internet. I have been using the Pi to control my WiFi light switches, so the setup for the meteo station is fairly simple.
The meteo station needs to monitor the following values: internal/external temperature and humidity, barometric pressure, display it on an LCD for a quick view, or on a webpage for a more detailed view and save all the data to display statistics. Of course, the specifications can be updated in order to have more data such as wind speed, precipitation and solar insolation, as long as there are the available sensors.
With those specifications in mind, let's start.
The Hardware
First of all, the aim is to build a low cost, high accuracy meteo station. Those two requirements contradict each other, however, because of the popularity of amateur electronics projects, those sensors are pretty low cost and easily available. The hardware used for the meteo station are:
- 2x AM2301 (DHT21) temperature/humidity sensors. Accuracy ±0.5C, ±3%.
- BMP180 temperature/barometric pressor sensor. Accuracy ±0.5C, ±1hPa.
- 20x4 Large size LCD display.
- I2C display module.
- BH-1750 light intensity sensor. Accuracy 20%.
- Custom PCB for the connection of all the above.
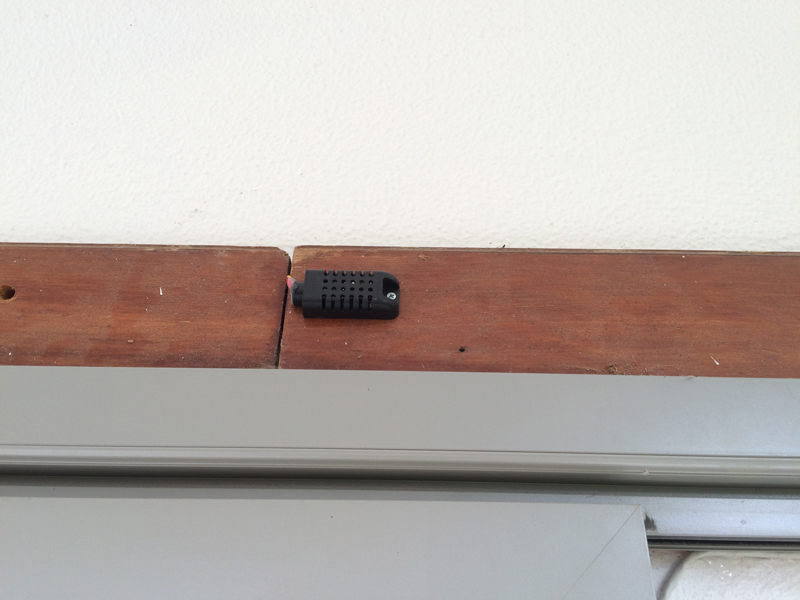
The AM2301 are medium quality, medium accuracy temperature and humidity sensors. The have their own case (important since one sensor will be mounted outdoors) and can operate with the 3.3V supplied by the Raspberry Pi. They have a one-wire communication protocol, so, each sensor is connected to one GPIO port on the Pi.
The remaining sensors communicate using I2C. The display uses an HD44780 controller, which requires at least 7 GPIO ports for communication and one for the backlight. As this is not practical (many GPIO ports lost, lots of wires), an I2C module is used. The I2C display module, mounted at the display connector, translates I2C messages to the 7 GPIO ports needed. It can also operate the backlight. Therefore, only 2 GPIO ports are used for the display, the same ports used for all the rest of the I2C sensors.
For this setup, 3 I2C peripherals are used. Attention must be given to the pull-up resistors connected to SDA and SCL. Typical values for these resistors are ~2kΩ. However, if the board of each peripheral has a 2kΩ pull-up resistor, we end up with a 667Ω resistance (three connected in parallel), or worse. This is because the suppliers consider that their peripheral will be the sole one on the bus. So, when connecting multiple peripherals, the pull-up resistors have to be removed (all but one).
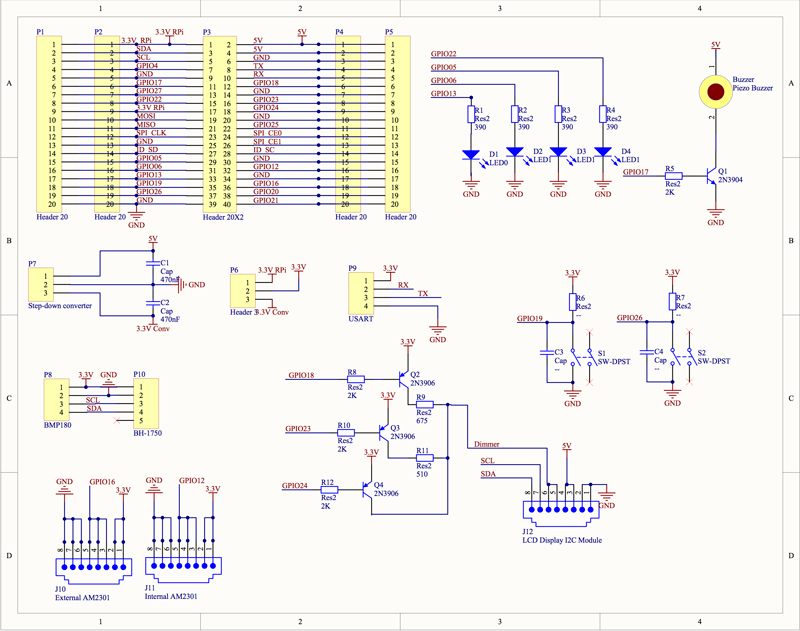
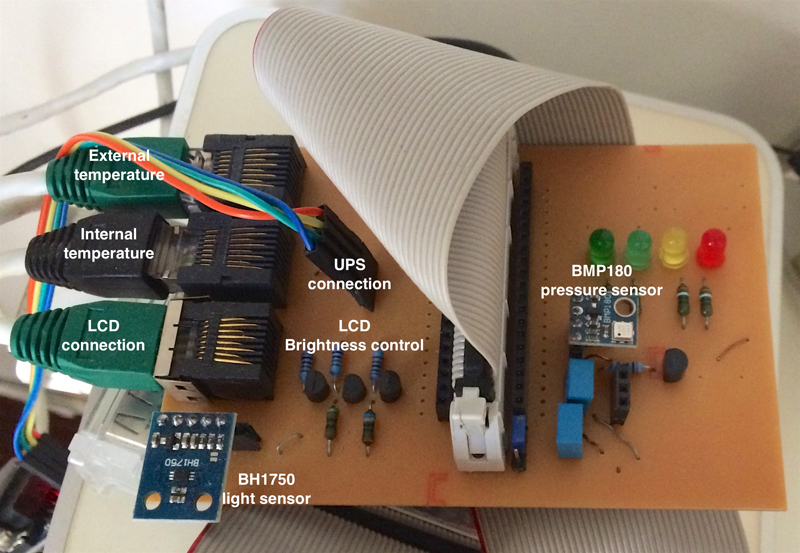
The schematic of the custom board is shown below. The 40 pin connector is in the middle with two 20 pin connectors on each side for prototyping and future upgrades. Four LEDs and two buttons are also installed, together with a buzzer (driven by a transistor). The lcd display backlight has three different resistances connected in series (one short circuit or different value resistors), which enables to have five different backlight brightness levels. Finally, the BMP180 and BH-1750 daughet boards are mounted on the main board, whereas there are three connectors for the remaining hardware, two for the temperature/humidity sensors and one for the display. I chose to use RJ-45 plugs and CAT-5 cable, since there are easy to find and install and rather reliable.
The Software
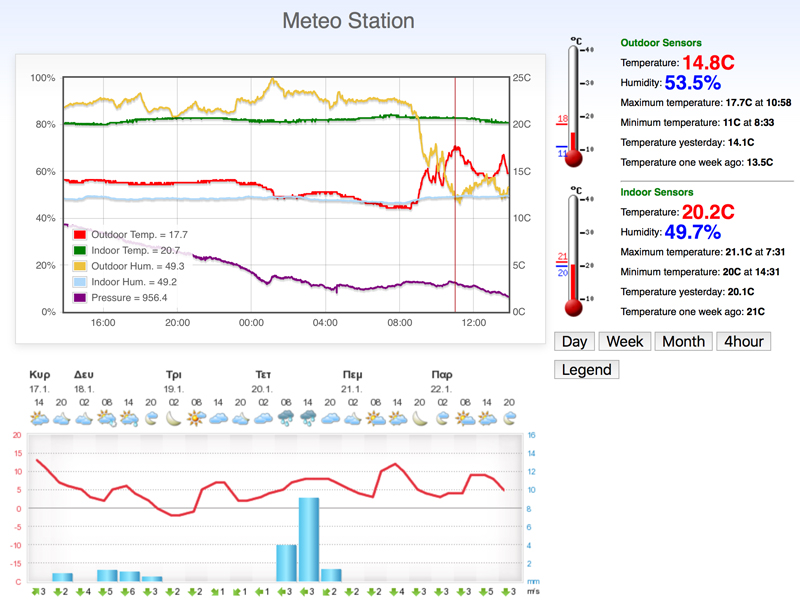
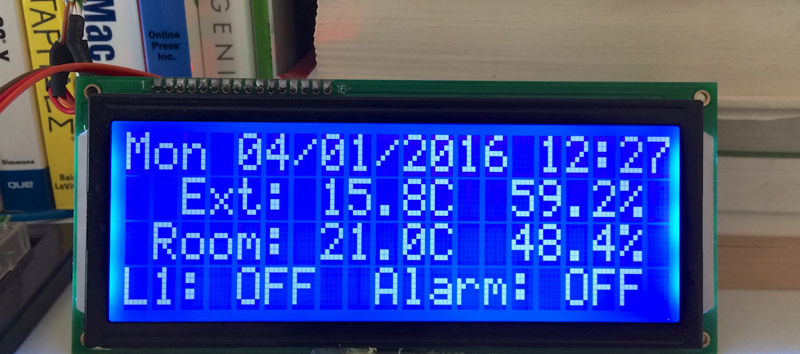
The software written is divided into two parts. First, there is the backend that gets the measurements every minute, stores them into a database and update the LCD. The display only shows the current measurements, due to the limited space. The data can also be monitored via a web client, where the current measurements are shown, together with a history of the past month, displayed as graphs.
So, to get the measurements and update the display, a program written in C launches every minute, via Cron. To get the measurements, subroutines are written for the BMP180 and the BH-1750, whereas the DHT22 driver is used for the AM2301 sensors. The WiringPi library is used to send the I2C messages. The messages are displayed to the LCD via a C program, based on the timing diagrams for the display. Finally, the CURL library is used to get the data from the Wi-Fi light switch and the MySQL library is used to log all the data to a MySQL database running on the Pi.
To display the data on the webpage, the Raspberry Pi runs an Apache Server. A PHP script is written to create the page, which gets the data from the database via JSON. A PHP script is used to display the temperature graphs and Flot is used to display the data charts.