My PhD has been on the efficiency optimisation of the flyback microinverter, which included experimental verification of a prototype device on a laboratory environment. This is all good to prove my theoretical analysis, but designing a device to be continuously connected on the grid and supply energy 365 days per year, autonomously, out of reach, under any condition and ride through the grid faults is an entirely different story. Nevertheless, I collaborated with current PhD candidates at my university laboratory to do just that.
The system comprises of an interleaved flyback microinverter, controlled by a TI Delfino C2000 microcontroller. Voltage, current (input and output) and temperature sensors are connected on the power converter. On the DC side, the converter is connected directly to a 200W solar panel, whereas it connects to the grid via a relay. The microcontroller performs all the low-level control:
- PWM generation to control the flyback interleaved phases
- Sampling of input/output voltage and current and temperature for protection and power derating
- Control of the relay depending on the PV and grid conditions to supply power to the grid
- Maximum Power Point Tracking algorithm
- Control of the internal fan
- Communication with the onboard Raspberry Pi
The focus of the present article is not on the power electronics, but on the surrounding system which controls the power converter and saves and presents the gathered data. As mentioned above, a Raspberry Pi is used to supervise the power converter operation. The Raspberry Pi is connected to the TI microcontroller via a bidirectional UART channel as well as a number of digital ports. It is also connected to the outside world via Ethernet, to get commands for maintenance and control override, as well as to to provide real-time and historic data of the converter operation. An external SSD is used to store the operating system, programs and all the gathered data.
The Raspberry Pi is running on the Raspberry Pi OS (command line only). The majority of the services are running docker containers, apart from the main converter controller daemon, which is written in C and runs as a UNIX service. The Raspberry Pi is also connected to temperature/humidity/pressure sensor via I2C. This is to check the ambient temperature, as well as to alert if there is excess humidity (due to a leak) inside the waterproof enclosure.
The controller daemon runs as a service and is written in C. The daemon reads the configuration via a .ini file, which contains settings both for the raspberry side (e.g. refresh time, database credentials) as well as for the microcontroller (e.g. MPPT step size, PV panel voltage to enable the converter), which are sent via UART. The daemon runs at a constant loop, but also supports interrupts, to respond to inverter faults (via the dedicated GPIO lines). The daemon is the supervisor which gathers all the data, saves them into the database for analysis/visualization by other software, determines the health of the system and alters the control accordingly. It also writes on the syslog server for later analysis. Finally, another operation of the daemon, via a subroutine, is to gather all the high sampling frequency data from the inverter during a fault, determine its severity and reenable power generation, if safe to do so. High sample frequendcy data of the operation during a fault (logged by the system) is shown below. More terminal programs, either written in C or Bash script are available on the Raspberry Pi, to override or alter settings, as the system needs to be controlled and updated remotely.
The remaining services are run in docker containers. This includes the MariaDB (MySQL) server, fileserver, cloud file upload and visualization engine, Grafana. Grafana is a free tool, which not only plots data from database and other sources, but also includes alerting and analysis tools, via database commands. Multiple pages are generated to show the high-level operation of the PV generation system, the low-level diagnostics of each subsystem, as well as the comparison of operation between different days of the year. Sample pictures of the various pages are shown below.
The microinverter frontpage can be found in the following link.
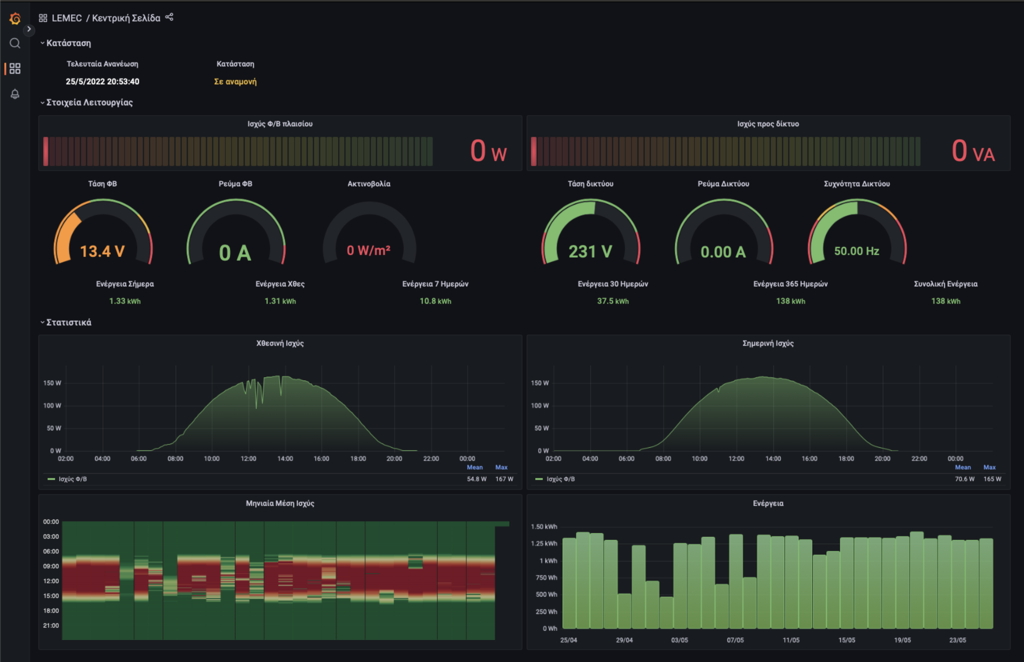
Figure 1: Frontpage of the microinverter website
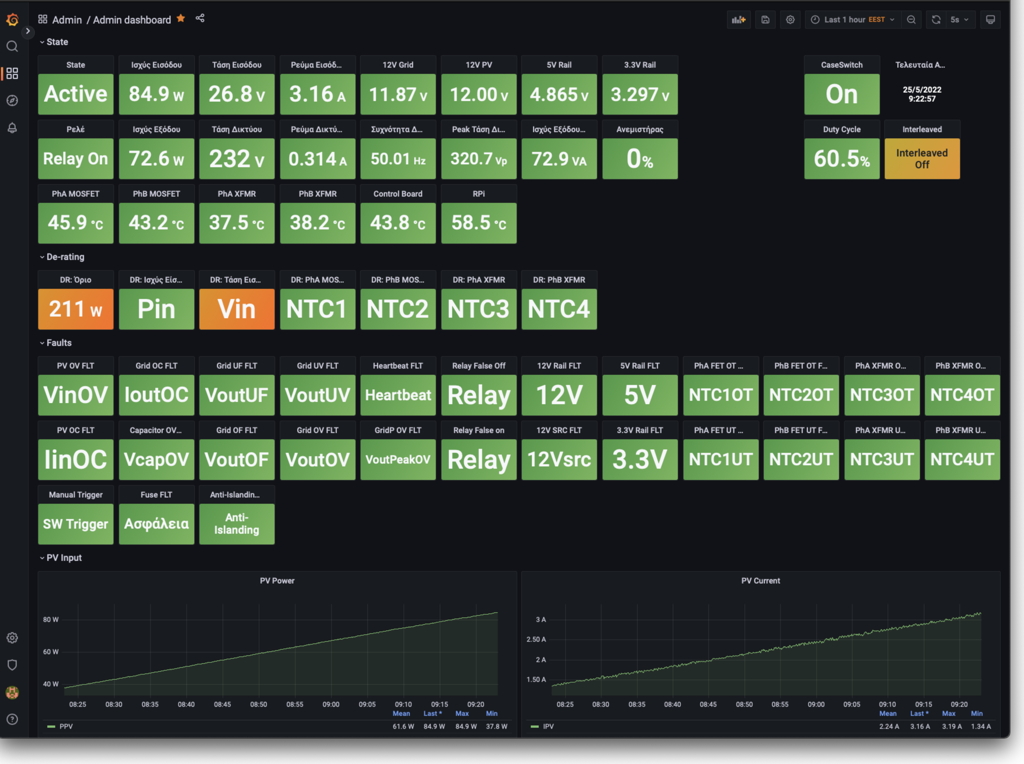
Figure 2: Admistrator status page of the microinverter operation

Figure 3: Comparison of microinverter key waveforms between two different days
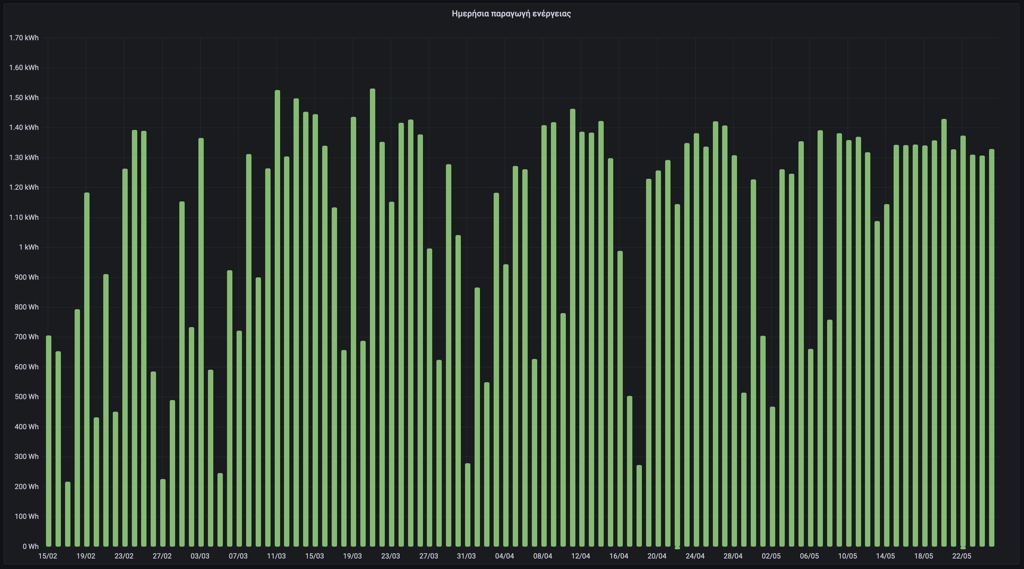
Figure 4: Daily solar panel power generation
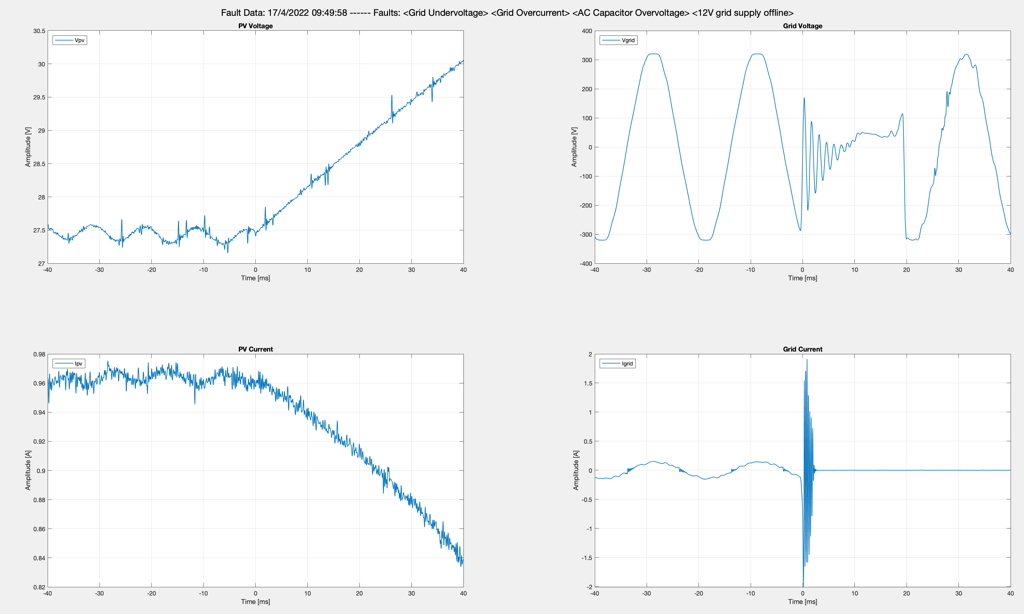
Figure 5: Fault logged waveforms during a grid undervoltage